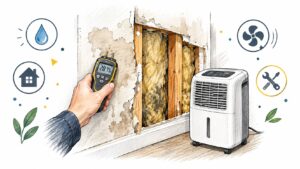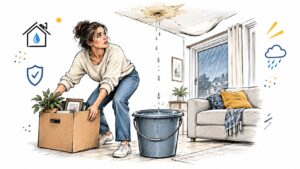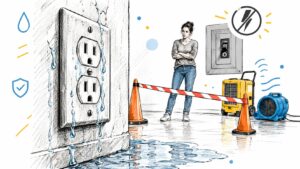
A supply line can fail while everyone is at work. By the time someone notices the water, it may have traveled beneath baseboards, into a hallway wall, under flooring, and through a ceiling assembly below. The visible stain is often the easiest part to find, not the full extent of the loss.
Moisture mapping gives a restoration team a defensible way to locate, record, and monitor that hidden wetting. It combines instrument readings, thermal patterns, material-specific dry standards, photographs, and floor-plan annotations so drying decisions rely on a changing pattern rather than one isolated meter result. In Georgetown and Austin, that process matters after plumbing failures, heavy rain, flash flooding, and indoor overflows, especially where slab-on-grade construction, tile, laminate, wood, and humid outdoor conditions complicate the assessment.
Why Moisture Mapping Matters After Water Damage
A family leaves for work after noticing nothing unusual under the kitchen sink. During the day, a small supply-line failure sends water into the cabinet base. The water moves under the baseboard, reaches the hallway flooring, and wicks into the lower portion of the wall. By evening, the only obvious sign may be a faint brown mark near the trim.
That mark doesn't define the drying zone. Capillary movement can pull water through porous materials, gravity can carry it into lower assemblies, and vapor can move through cavities after the original leak has stopped. Carpet padding, subfloors, insulation, drywall edges, and enclosed voids may hold moisture even when the exposed surface feels dry.
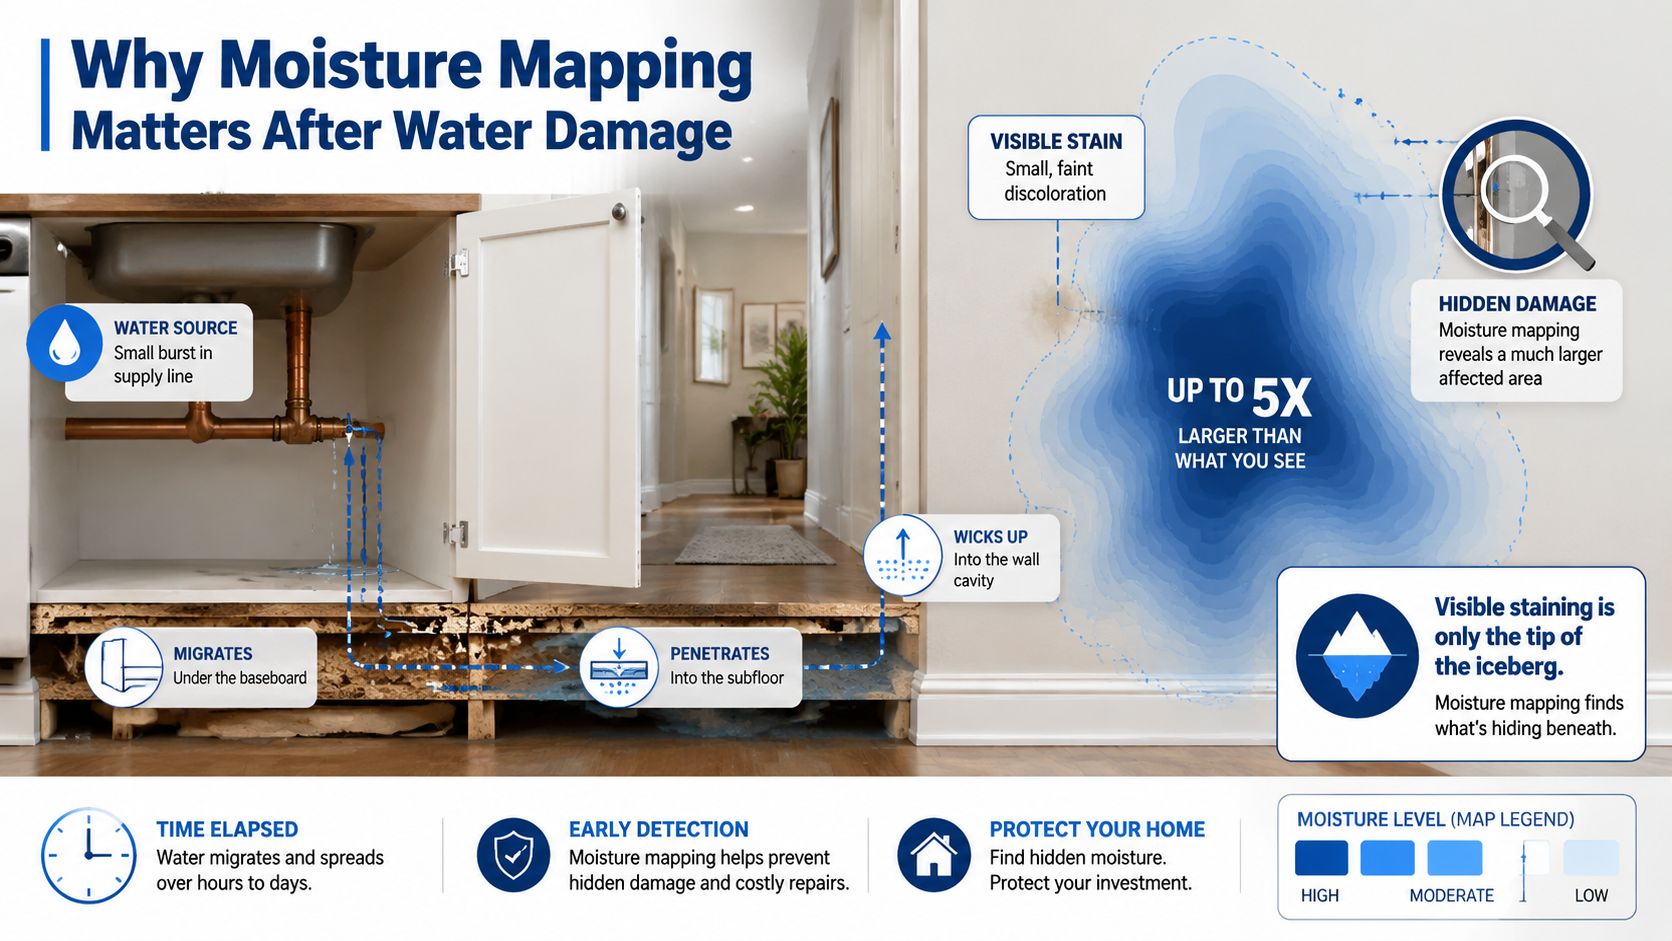
The visible stain isn't the scope
A technician doesn't treat the stain as the diagnosis. The assessment compares suspect areas with unaffected materials of the same type, then records where readings change across the room. That distinction is important because drywall, hardwood, concrete, carpet padding, and wood subfloor respond differently to water and dry at different rates.
The map also shows where equipment should work. Air movers can be directed along wet edges, dehumidification can support affected rooms, and containment can be placed around the actual drying zone instead of the visually obvious patch. Targeted placement is more practical than scattering equipment throughout a home without knowing which assemblies remain wet.
Practical rule: A room isn't ready for reconstruction because the wall looks better. It's ready when documented readings meet the appropriate dry standard and the surrounding assemblies have been checked.
A record for everyone involved
Moisture mapping protects more than the structure. Homeowners gain a clearer explanation of what happened, property managers can coordinate access and repairs, and claims staff can review the affected footprint with supporting readings and photographs. The record also helps separate drying work from later repair decisions.
The IICRC S500 formalized moisture mapping within professional water damage restoration. Its definition describes documentation that visually indicates water migration by showing affected areas and immediately adjacent unaffected areas, as summarized in this overview of moisture mapping and the IICRC S500 framework. That historical role still matters today because restoration teams need a consistent way to explain why a wall, floor section, or ceiling cavity belongs in the drying plan.
Understanding the Moisture Mapping Process
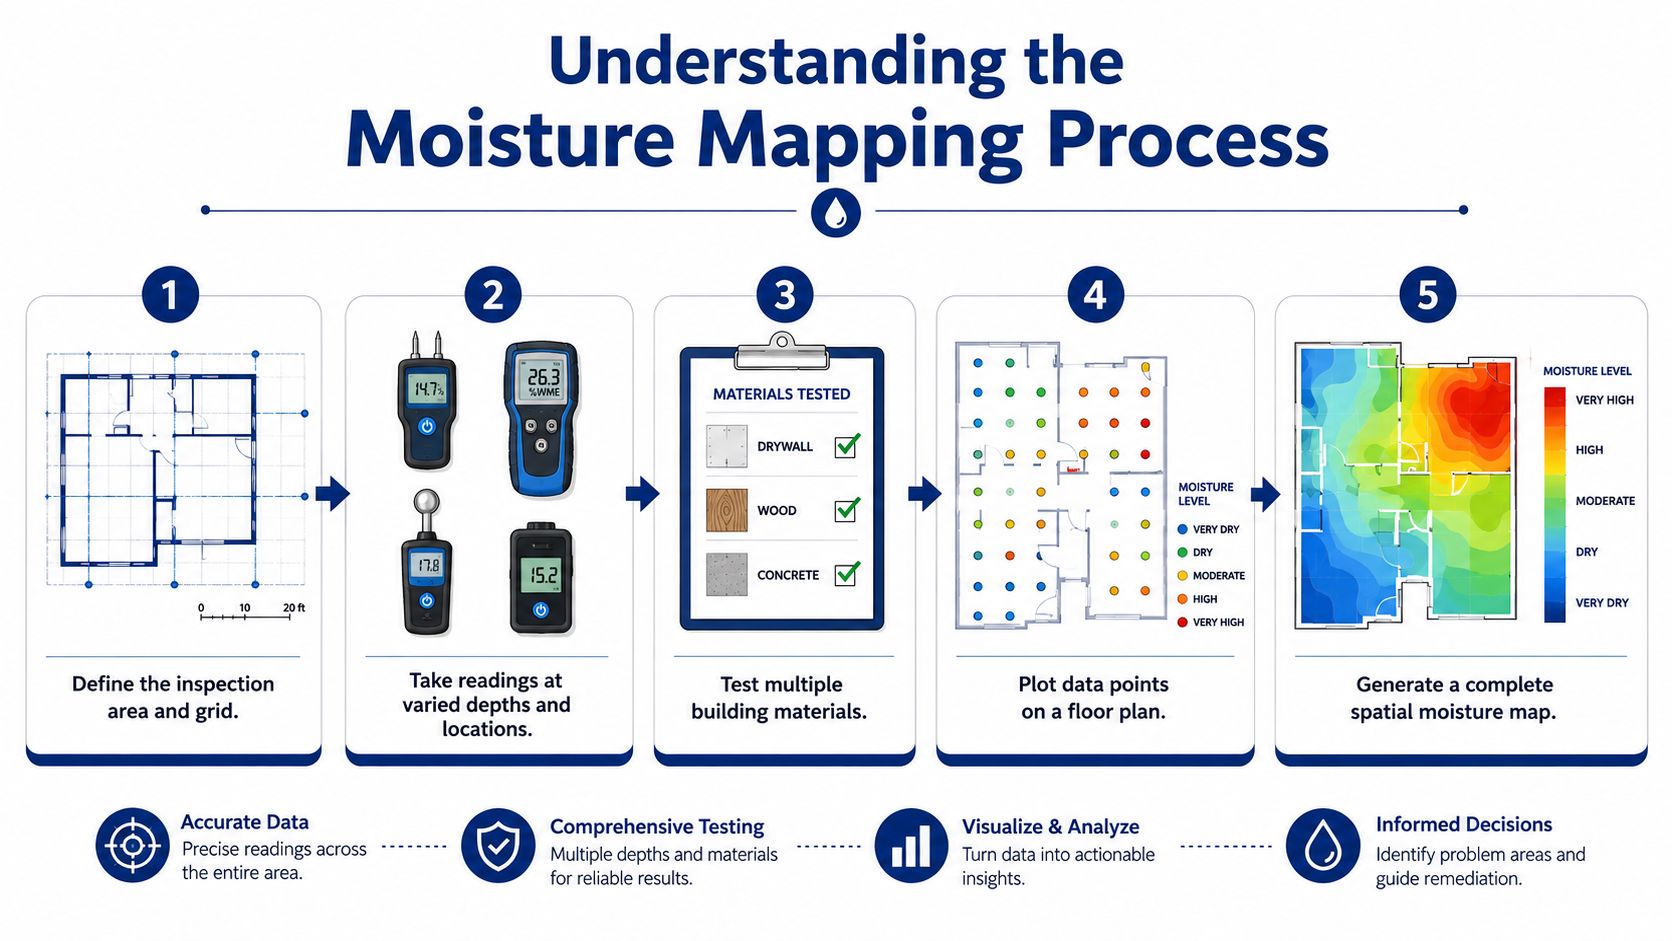
Moisture mapping is best understood as a weather map for a building. A weather station gives a reading at one location, but a meteorologist needs many stations to understand how conditions change across a region. In the same way, a moisture meter gives a reading at one point, while the map shows how wet conditions shift from a cabinet, to a wall, to a hallway, or from a room edge toward an unaffected area.
The process starts by defining the inspection area. The technician identifies rooms, assemblies, likely migration paths, and reference points that can be found again during follow-up visits. A rough sketch may show where water was seen, but a useful map records where the reading was taken, what material was tested, which instrument was used, and what the result showed.
Building the record
A practical assessment usually combines several layers of information:
- Site orientation: The technician notes the source, affected rooms, visible damage, construction materials, and time since the loss.
- Broad scanning: Non-invasive instruments screen walls, floors, ceilings, cabinets, and other surfaces for areas that need confirmation.
- Depth confirmation: Pin or penetrating measurements help determine whether moisture is near the surface or deeper within the assembly.
- Material comparison: Readings are compared with unaffected materials of the same type, creating a local dry baseline.
- Spatial plotting: Findings are placed on a floor plan, diagram, or digital record with room labels and reference points.
A single reading can't establish the shape of the drying zone. A pattern of readings can show a boundary, a pocket, a vertical migration path, or a section that has stopped improving.
Why mapping continues after day one
The first map establishes the baseline. After equipment is installed, the technician returns to the same reference points and records new readings. Consistent locations make the comparison useful, while changing locations randomly can create the appearance of progress or failure that reflects sampling rather than actual drying.
Property owners who want more detail on interpreting a meter result can review this guide to moisture meter readings. The important point is that the reading only becomes meaningful when tied to material, location, instrument settings, and the surrounding environmental conditions.
Instruments and Measurement Standards
No instrument should carry the entire diagnosis. Each tool answers a different question, and the strongest assessment uses the tools together.
A non-invasive moisture meter helps scan a broad area without immediately puncturing walls or finishes. Pin and pinless meters can identify suspect zones, while penetrating confirmation helps determine whether moisture extends into the material. A thermal camera adds a different view by showing surface temperature patterns that may indicate evaporative cooling or hidden wetting. A thermo-hygrometer records air temperature and relative humidity, two conditions that influence evaporation and the drying environment.
What each tool contributes
| Instrument | Primary Use | Limitation to Note |
|---|---|---|
| Non-invasive moisture meter | Screen larger areas behind or beneath surfaces without immediate damage | Readings can be influenced by material density, salts, metal, and nearby construction features |
| Pin meter | Confirm moisture at contact points and, where appropriate, at depth | Pin penetration can damage finishes and may be difficult in dense materials |
| Pinless meter | Scan surfaces and assemblies quickly without pin holes | It can respond to changes in density or embedded materials that aren't water |
| Thermal imaging camera | Locate temperature anomalies and visualize possible hidden migration paths | A thermal pattern shows temperature, not moisture by itself |
| Thermo-hygrometer | Record ambient temperature and relative humidity for drying decisions | Environmental readings don't identify the location of moisture inside an assembly |
Thermal imaging is especially useful when water has moved behind cabinets, walls, or other finishes that can't be opened immediately. One published analysis reported 92% sensitivity for thermography compared with 68% for meters alone, and the combined approach identified 15 hidden sources in that analysis, as described in this technical performance analysis of infrared moisture detection. Those figures apply to the cited analysis, not to every building or inspection.
Standards make readings comparable
A meter result has no universal meaning outside its material and baseline. The technician needs a dry-standard reading from an unaffected area of comparable drywall, wood, concrete, or other material. The IICRC S500 framework and manufacturer equilibrium moisture content guidance provide reference points, but field interpretation still depends on the assembly and ambient conditions.
Thermal sweeps also have practical limits. A technical guide notes that a thermal sweep is most reliable when the interior and exterior temperature difference is at least 10°F, because a smaller difference can reduce the visibility of evaporative cooling. The same guidance is available in this explanation of moisture mapping and thermal detection conditions.
In Central Texas, hot outdoor surfaces, air conditioning, sun exposure, and humid weather can all create temperature contrasts unrelated to a leak. A competent technician treats a thermal image as a lead, then confirms the pattern with material readings and reference-area comparisons. Before relying on a result, verify that the equipment is maintained and moisture meter calibration is current.
Inspection to Reporting Workflow
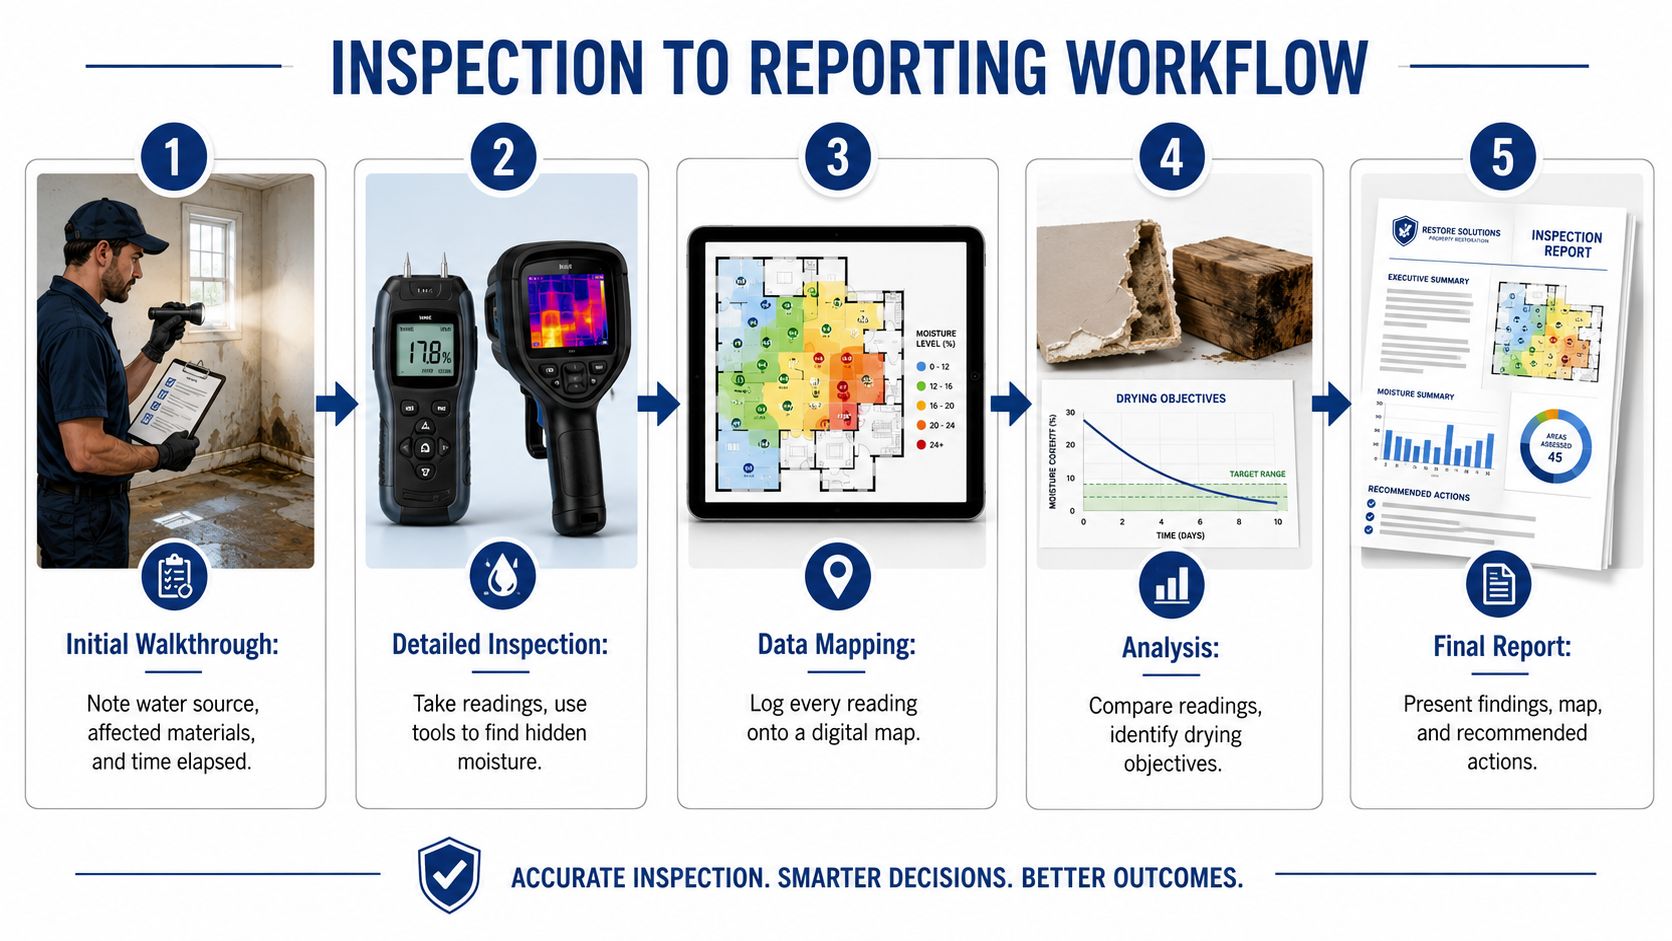
A professional assessment begins before the first meter touches a wall. The technician documents the water source, identifies safety concerns, notes the elapsed time, and records which rooms and materials may have been exposed. A burst line, an appliance overflow, and storm intrusion can create different migration patterns and may require different inspection priorities.
From walkthrough to mapped readings
The room-by-room inspection then follows the water path. Non-invasive scanning helps locate suspect areas across walls, floors, ceilings, cabinets, and trim. Penetrating measurements confirm selected points and help distinguish surface concern from deeper saturation.
The technician places those points on a floor plan or digital diagram. Useful records include:
- Material identification: Drywall, hardwood, carpet padding, concrete, insulation, laminate, and subfloor should not be treated as interchangeable.
- Reference locations: Points near corners, doorways, baseboards, cabinets, and suspected migration paths should be easy to find again.
- Instrument details: The record should identify the meter or camera used and relevant settings where they affect interpretation.
- Environmental conditions: Temperature and relative humidity help explain why evaporation is moving quickly, slowly, or unevenly.
- Visual evidence: Photos connect the plotted data to stains, openings, equipment placement, and visible assembly conditions.
Thermal imaging supplements this record by showing patterns that may extend beyond the obvious damage. It doesn't replace physical confirmation. A cool strip behind a cabinet might reflect evaporation, an air leak, a cold-water line, or another temperature difference, so the technician must test the area and document the conclusion.
Repeat visits show whether the plan works
Follow-up readings matter because drying is a process, not a declaration. The technician returns to the same points, compares the new results with the baseline, checks environmental conditions, and adjusts air movers or dehumidification when the pattern stalls. A wall that improves while a subfloor pocket remains unchanged needs a different response from a room that is drying consistently.
The final documentation package should connect the beginning and end of the work. It commonly includes initial and follow-up readings, annotated thermal images, photographs, equipment logs, room notes, and a final moisture map. A clear thermal imaging inspection record can help claims staff understand why a concealed area was included in the drying scope or why a repair boundary changed.
Turning Findings Into a Drying Plan
A moisture map becomes useful when it changes what the crew does. The first decision is to interpret each affected material against a comparable dry standard. Drywall, hardwood, wood subfloor, and concrete don't absorb, release, or retain water in the same way, so one target cannot govern every assembly.
Material and equipment decisions
The mapped footprint helps define containment. If readings extend past the visible stain into a hallway or closet, the drying zone should account for that migration. If an unaffected room sits beside the wet area, barriers and airflow control can help prevent unnecessary exposure.
Equipment placement should follow the wet pattern rather than the room's appearance. Air movers work along wet edges and across exposed materials, while dehumidifiers support moisture removal from the air. Environmental readings, room volume, material response, and the extent of grain depression in the drying environment all inform equipment selection. A technician may start with one arrangement, then relocate or remove equipment as repeat readings show which assemblies are responding.
| Material | Typical Dry Target | Equipment Implication |
|---|---|---|
| Drywall | Compare with unaffected drywall in the same structure and account for wall depth | Air movement should reach exposed faces and edges, while concealed wet areas may require controlled access |
| Hardwood | Compare with unaffected wood of the same or similar construction and finish | Airflow must be controlled to reduce uneven drying and additional movement |
| Wood subfloor | Use comparable dry sections and inspect below or beside floor coverings where possible | Equipment may need to address both the room surface and trapped moisture beneath finishes |
| Concrete | Compare readings with unaffected slab areas and interpret depth limitations carefully | Drying can require sustained dehumidification, surface access, and patience with moisture held below the surface |
When the map changes repair scope
Repeat mapping can show that a material is drying without removal, or that a hidden pocket isn't responding and needs selective demolition. That distinction affects flooring replacement, insulation removal, antimicrobial treatment boundaries, and the timing of reconstruction.
Recent building research identifies a continuing challenge around sensor selection, interpretation across assemblies, practical thresholds, and uncertainty. The review of moisture monitoring methods in buildings also highlights the need to connect measurements with physical models and clearer uncertainty evaluation. In practice, that means a drying plan should state what is known, what remains uncertain, and what observation will resolve it.
Public explanations often reduce mapping to a flat surface diagram. Recent work instead describes multi-source, depth-aware approaches involving radar and thermal fusion, mobile robotics, and machine-learning downscaling, while identifying deeper-layer moisture, cross-sensor consistency, and uncertainty as unresolved challenges in many applications. This review of high-resolution moisture mapping approaches supports a practical conclusion: more data isn't automatically better. Higher resolution matters when it changes equipment placement, access, containment, or repair decisions.
Common Misinterpretations and Limitations
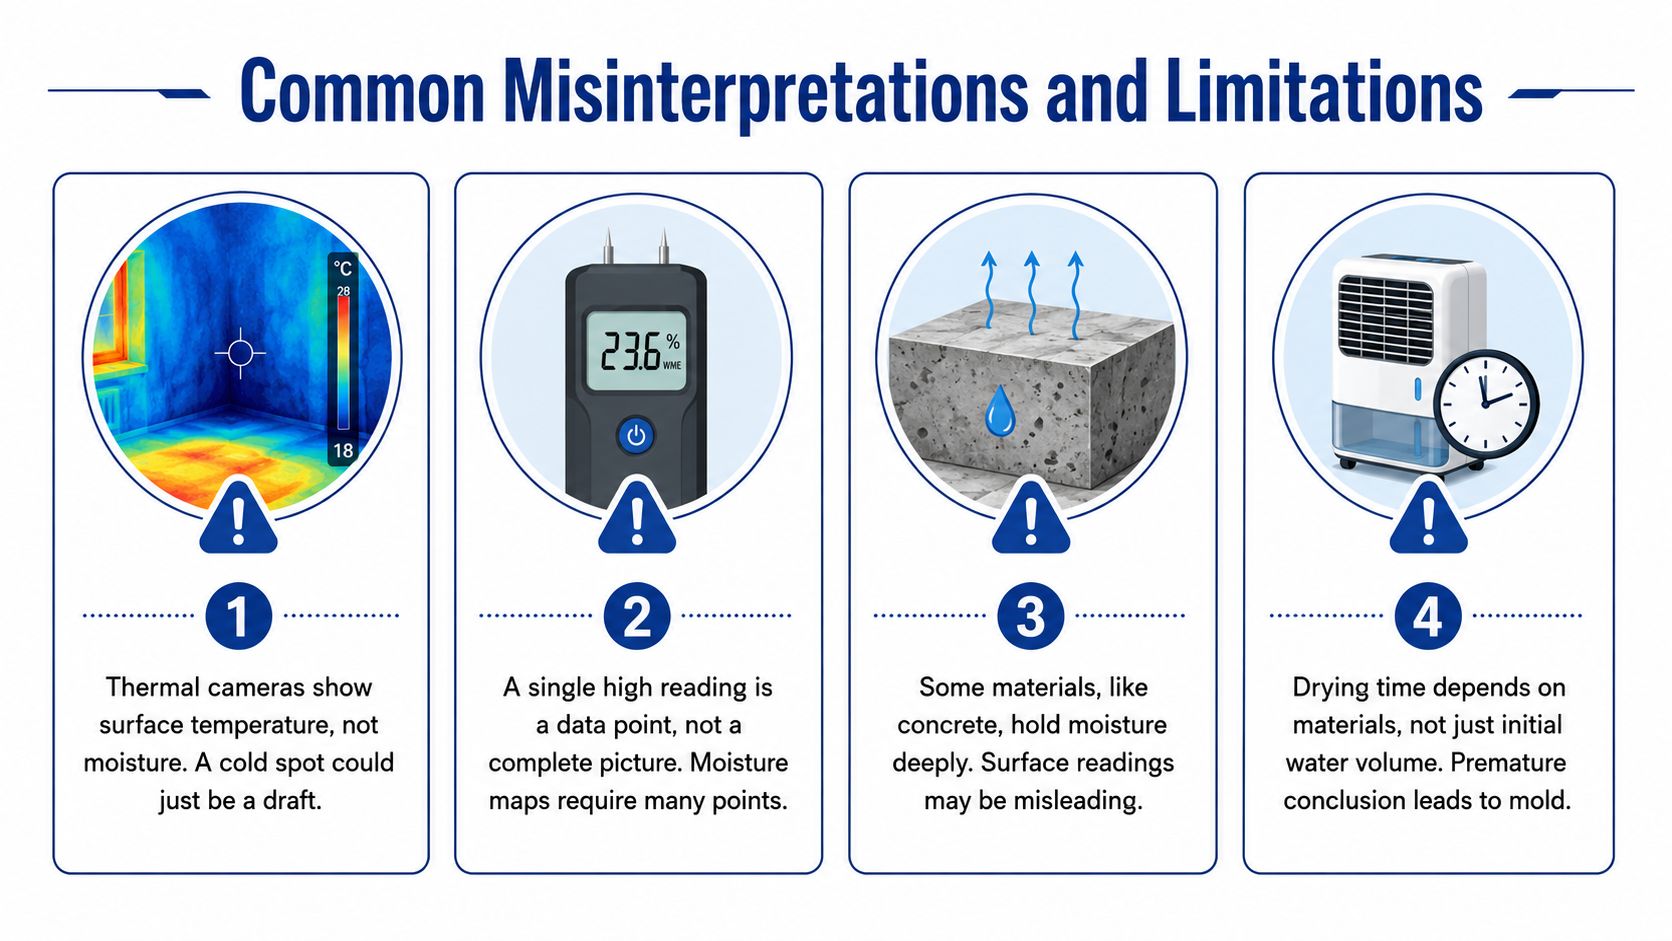
A thermal camera can display striking blue and red areas, but those colors represent surface temperature. A cool patch may indicate evaporation, yet it could also result from a draft, air-conditioning flow, a cold pipe, shading, or a change in construction. Thermal imaging is valuable for finding questions to investigate, not for declaring every colored area wet.
The same caution applies to meters. A single high reading identifies a data point, while a single low reading doesn't clear an entire room. Professionals look for patterns across fixed points, compare suspect materials with unaffected baseline areas, and repeat the measurements under documented conditions.
Why universal targets cause trouble
Wood, concrete, and gypsum respond differently to water and ambient humidity. A target that makes sense for one material may be meaningless or misleading for another. Dense concrete can hold moisture below the surface, while a surface reading may not represent the full slab condition. Hardwood can also respond unevenly when finishes, boards, and subfloor conditions differ.
Even a calibrated meter can produce confusing results. Surface salts, condensation, contact pressure, fasteners, wiring, and material density can affect the response. The technician reduces that uncertainty by using more than one measurement method and noting limitations instead of presenting a number as absolute.
The missing trend
Skipping return visits is one of the most damaging documentation gaps. Without repeat readings at consistent points, the team can't reliably identify a stalled area, confirm that equipment is working, or support a final drying decision.
A strong report identifies uncertainty directly. It explains which areas were accessible, which readings were confirmed by another method, what baseline was used, and what evidence supports the conclusion. That transparency helps homeowners and claims staff distinguish verified drying from an assumption based on appearance.
Georgetown and Austin Restoration Examples
Consider a representative two-story home in Georgetown after a second-floor supply line bursts overnight. Bedroom carpet and padding are visibly soaked, but the inspection doesn't stop at the floor covering. Moisture mapping traces wicking along the baseboards, identifies wet insulation in the ceiling cavity below, and finds a concealed pocket in the tongue-and-groove subfloor.
That pattern supports a more precise plan. The crew can remove only the flooring sections that can't be dried effectively, open the affected ceiling area where access is necessary, and direct equipment toward the subfloor pocket and ceiling cavity. The map also gives the property owner and claims staff a shared explanation for why the visible bedroom damage doesn't represent the entire scope.
Austin presents a different scenario. Heavy storms push water through a sliding door at a single-story property near a flood-prone creek. Water spreads across tile, reaches adjacent drywall, and affects look-laminate flooring. The visible stain ends at the room opening, but readings show migration into a hallway closet.
The containment boundary therefore extends beyond the obvious wet line. The technician records the tile edge, drywall readings, laminate condition, closet readings, and nearby unaffected areas so the drying zone reflects the measured spread rather than the first visible mark.
Central Texas construction and weather influence how these losses are interpreted. Slab-on-grade foundations can move water laterally beneath finishes, tile can conceal conditions below its surface, and humid outdoor air can affect the drying environment. Those local factors don't replace measurement, but they make a documented, material-specific assessment more useful than visual inspection alone.
What Property Owners Should Expect
A qualified moisture mapping assessment should leave you with more than a meter number. Expect an initial inspection that identifies the source, affected materials, visible conditions, and likely migration paths. A useful record clearly labels affected and unaffected zones, shows where readings were taken, and connects photographs or thermal images to identifiable reference points.
Ask these questions before drying begins:
- What was measured: Were pin, pinless, thermal, and environmental tools used where appropriate?
- What was compared: Which unaffected materials established the dry baseline?
- What will happen next: Where will air movers and dehumidifiers go, and what conditions will trigger a change?
- How often will the site be checked: Will the same reference points be re-measured and documented?
- What belongs in repair scope: Which materials need removal, and which can be dried in place?
- What proves completion: Will the final report show readings, photographs, equipment history, and verification against material-specific standards?
These checkpoints protect the property owner, give managers a defensible record, and help claims staff evaluate drying and reconstruction separately. They also reduce the chance that a crew rebuilds over a damp pocket because the surface looks normal.
RestoTek TX provides water damage inspection, moisture mapping with thermal imaging and moisture meters, structural drying, microbial prevention, and reconstruction for properties in Georgetown, Austin, and surrounding Central Texas communities. When a plumbing failure, storm intrusion, or flood leaves uncertainty behind, visit RestoTek TX to request an assessment and discuss the documented drying steps your property needs.